KML plot in R
How to overlay a path in form of a kml file over the Swiss digital elevation model using R.
by Lorenzo Clementi |
Comments |
Images |
Reading time: 1 - 2 min
Some time ago I wrote a post about representing swiss terrain and borders in R. During this snowy week-end I spent some time extending this code, which is available in the zip file just below this post.
The new version of the program works like this: given as input a KML file describing an itinerary (e.g. a running path), the program produces three plots (see examples at the end of this post). Note that KML files are a common format produced by several mobile phone apps and they can also be created directly on GoogleEarth.
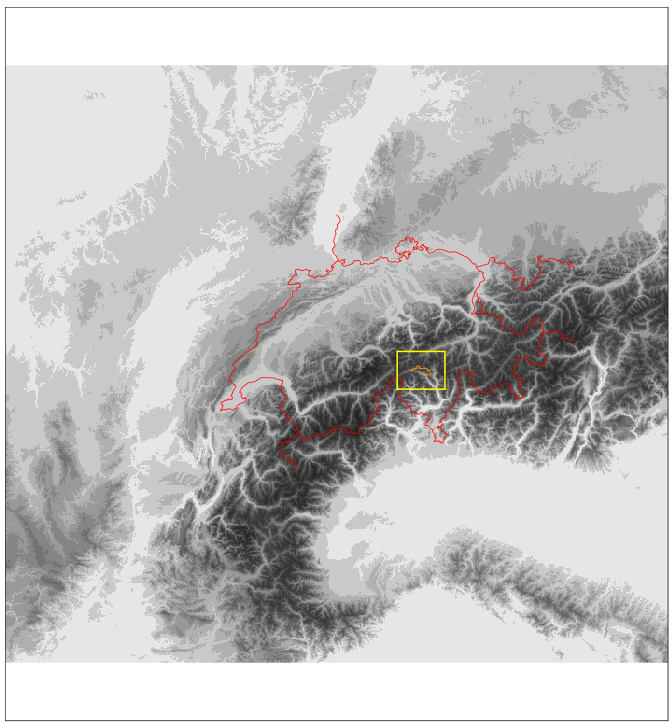
The first output plot is very similar to what was already presented in my previous post, that is, the map of Switzerland showing the region of the intinerary in a yellow square.
In yellow the input itinerary (KML file).
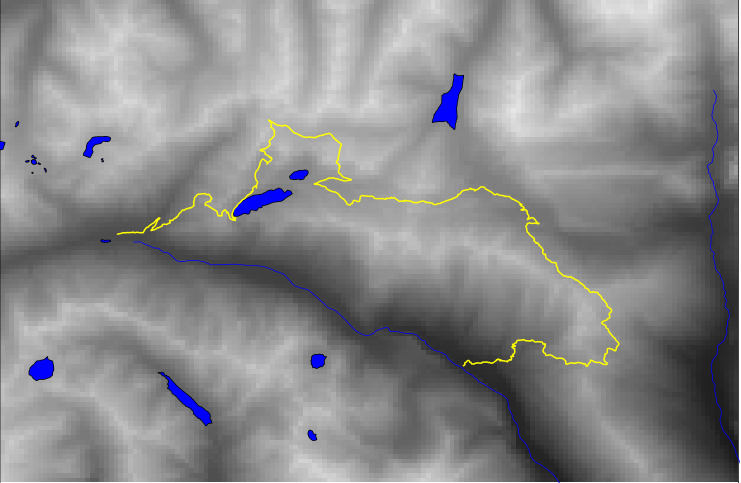
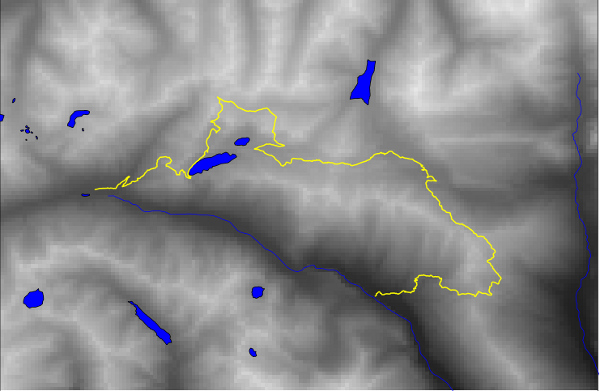
The second plot presents a zoom of the region: the digital elevation model used here is more precise with respect to what is used for the overview image. This dataset, called DHM200 has a pixel size of 200m and is freely available on the swisstopo website. Furthermore, this plot shows also the main rivers and the swiss lakes: this data was downloaded from mapcruzin.com.
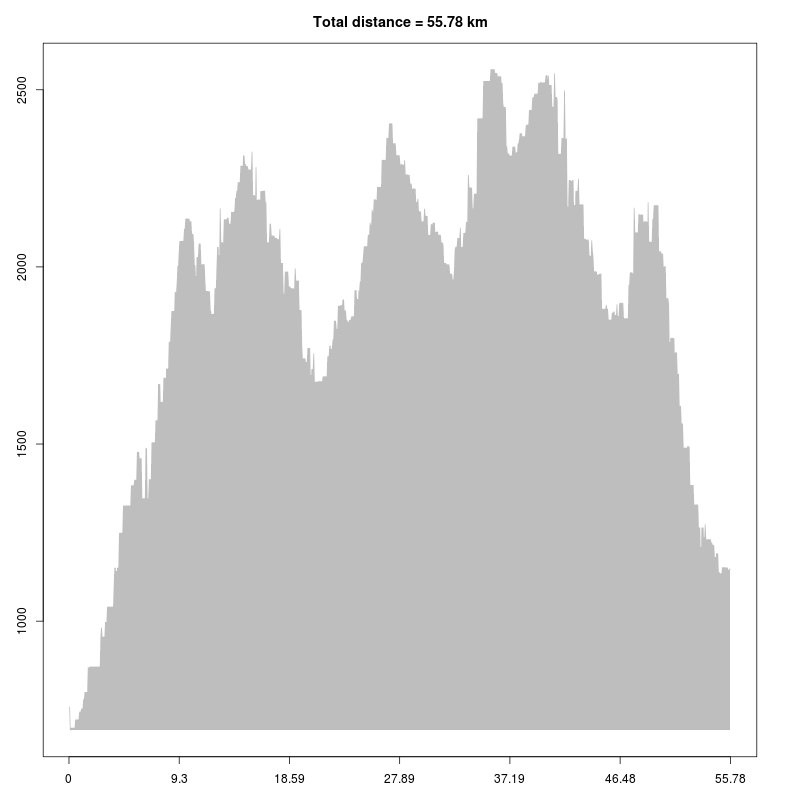
Finally, the third plot shows an elevation profile of the itinerary given as input. This elevation profile is based on the 200m DEM.
The images below are an example of the three plots produced by this tool using as input the intinerary of the Semi Trail Ticino 2013, whose KML file is available on the website. (Read more about the first edition of the Trail Ticino).
The source code can be downloaded here and should be easy to understand. Basically, there is a shell script that calls the R program and passes the KML file to the latter.

This post has an attachement: download it here.